An Overly Serious Analysis of Hi-Ho! Cherry-O
We bought my 4 year-old Hi-ho! Cherry-O for Christmas. It is apparently a classic game that I was previously unfamiliar with that helps children practice counting skills.
The rules are simple. Each player starts with 10 cherries on their tree. Starting with the youngest player and then proceeding in age order you take turns spinning a spinner. Depending on the spin you either remove some cherries from the tree or add some back. First player to get all 10 cherries off the tree wins.
We had fun playing. We took turns doing the counting in English, Spanish, and Korean.
However, I’m the oldest in the family and I’m a crazy person who might have a problem with being too competititve, so I was bothered by the disadvantage of going last in a game where each spin increases your chance of winning. I wanted to figure out exactly how much of a difference starting position makes for your chance to win the game.
I’ve also conceptually understood Monte Carlo simulations but had never had a problem that required one. This seemed like a good toy problem to actually use them.
So… I did what any completely well adjusted adult who is frustrated by a small disadvantage against their 4 year-old in an educational game does: I coded up a Ruby version of the rules of the game and then used my laptop to play 1 million games and record the results.
Code is available here.
Here’s what I learned:
Probability of Winning
In a four person game the first player (my 4 year-old) has about a 5% advantage against the fourth player (me).
Results of playing 1,000,000 4-person Hi-Ho! Cherry-O games:
| Player | % of Games Won |
|---|---|
| Player 1 | 27.6827% |
| Player 2 | 25.7844% |
| Player 3 | 24.0927% |
| Player 4 | 22.4402% |
In the long term the winning probability converges. But, much like coin flips, randomness in the short run can easily outweigh the long run averages as you can see in this graph showing the cumulative win percentage.
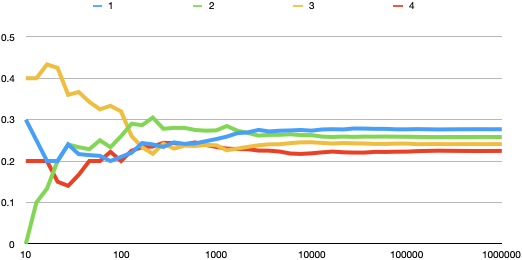
In this simulation, after several hundred games Player 4 had actually won more games than Player 1. It also took until about 4,000 games had been played before the players’ ranking settled into the order of their win probability.
Using the simulation I also figured out the probabilities for 3-person and two-person games. Starting position still matters, but the difference isn’t as great.
Results of playing 1,000,000 3-person Hi-Ho! Cherry-O games:
| Player | % of Games Won |
|---|---|
| Player 1 | 35.7807% |
| Player 2 | 33.3239% |
| Player 3 | 30.895% |
Results of playing 1,000,000 2-person Hi-Ho! Cherry-O games:
| Player | % of Games Won |
|---|---|
| Player 1 | 51.872% |
| Player 2 | 48.128% |
Game Length
I also recorded game length (defined as total number of turns from the winning player. That is, if Player 4 wins on their third spin I counted that as 3 turns)
In theory, a game of Hi-Ho Cherry-O could continue forever. The probability of longer games just gets vanishingly small.
In the 1,000,000 4-player simulation I ran:
- The shortest game was 3 turns
- The average took 6.44 turns
- The longest game took 46 turns!
Ruby Performance
Ruby is not a particularly efficient computational langauage and I was running this on a 5-year old MacBook Air.
Still, Hi-Ho Cherry-O is a pretty simple game, so the simulations ran very quickly.
2.6.0 :019 > Benchmark.measure{ Simulation.new(4, 1_000_000).run }
 => #<Benchmark::Tms:0x00007fac0d048a10 @label="", @real=11.479035999625921, @cstime=0.0, @cutime=0.0, @stime=0.136068, @utime=11.156594000000002, @total=11.292662000000002>
Pretty crazy that you can run a million games in less than 12 seconds.
More Articles on Software & Product Development
- Agile With a Lowercase “a”
- ”Agile“ is an adjective. It is not a noun. It isn’t something you do, it is something you are.
- How Do You End Up With A Great Product A Year From Now?
- Nail the next two weeks. 26 times in a row.
- Build it Twice
- Resist the urge to abstract until you've learned what is general to a class of problems and what is specific to each problem.